Contact us
Help docs
MotorsportReg Home
Blog
Modernizing Rally Notes
by Brian Ghidinelli
January 3, 2013
Kids Just Aren't Into Cars
by Brian Ghidinelli
November 7, 2012
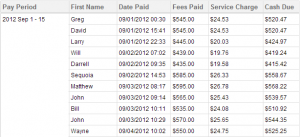
Revenue Report Breaks it Down
by Brian Ghidinelli
October 9, 2012
Saving Leading Zeros
by Brian Ghidinelli
September 18, 2012
DoesWhat.com interviews Brian Ghidinelli
by Claire Lanyado
September 4, 2012
Move & Copy Registrations
by Brian Ghidinelli
August 29, 2012
Webinar Recording Posted
by Claire Lanyado
July 18, 2012
How You Can Be Faster On MSR
by Claire Lanyado
June 28, 2012
MotorsportReg.com coming to PCA Parade!
by Claire Lanyado
June 25, 2012
Tracking results for editorial calendars
by Brian Ghidinelli
June 19, 2012
Older posts
Newer posts
Privacy
Terms
Help docs
Contact us
© PMH MSR LLC